
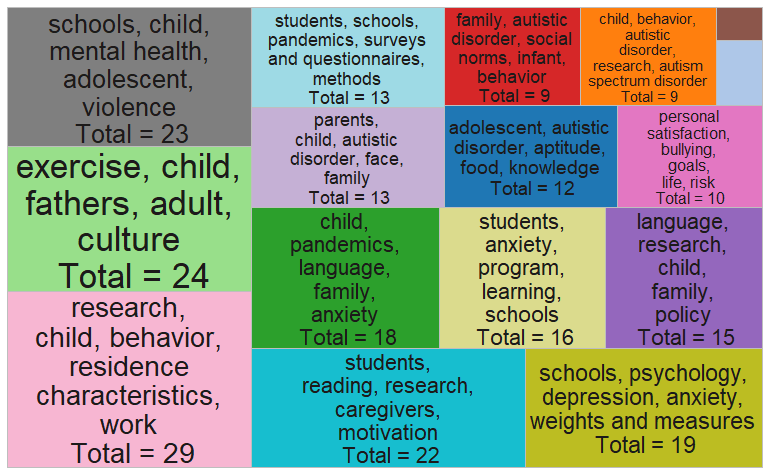
What’s been published in the past 30 days?
We’ve been monitoring the recent themes and trends, and here’s some stuff that has come out. Below is a treemap. A treemap is a visual tool for displaying hierarchical or categorized data using nested rectangles, where the size of each rectangle represents a quantitative value, in this case, the number of articles. Larger rectangles indicate higher values, while colors can be used to differentiate categories or represent trends.
Step into the Future of School Psychology!
Engage with the dynamic field of educational mental health for only $5 monthly. This Week in School Psychology offers you a gateway to understanding and applying crucial psychological findings. Enjoy concise, powerful updates that make a difference. Subscribe and join a community dedicated to knowledge and impact. Take advantage of our special yearly rate and lead the way in educational innovation!