The Post-Graduation Shift: Surprising Trends Among Exeter’s Seniors
Last year, I took a deep dive into where Exeter High School grads, the place where I live, were headed after graduation over at my other website. As a (failed) school board candidate with a not-so-failed obsession with youth development, I decided to sift through the school’s Facebook announcements and actually code every student’s post-grad plans. Nerdy? Maybe. Useful? Definitely. That work showed us the flow of students into college, trade schools, the military, and other pathways.
We learned some interesting facts, such as the fact that nearly 10% of the class attended Penn State, and we broke down military enlistment by branch. We also examined the number of students entering the PASSHE (the ten state-owned universities) system compared to other schools.
This year, I wanted to go a step further.
Instead of just examining one graduating class, I compiled four years of data going back to the class of 2022 to see how student plans have evolved. Are more students going to college? Fewer? What’s happening with trade school, the workforce, or students who aren’t quite sure what’s next? By analyzing this data, we can see not just what changed, but how big those changes were.
Let’s take a look at what the data tells us, and what it might mean for how schools support students on their next steps.
The Class of 2025
Okay, let’s first look at the overall tree of options.
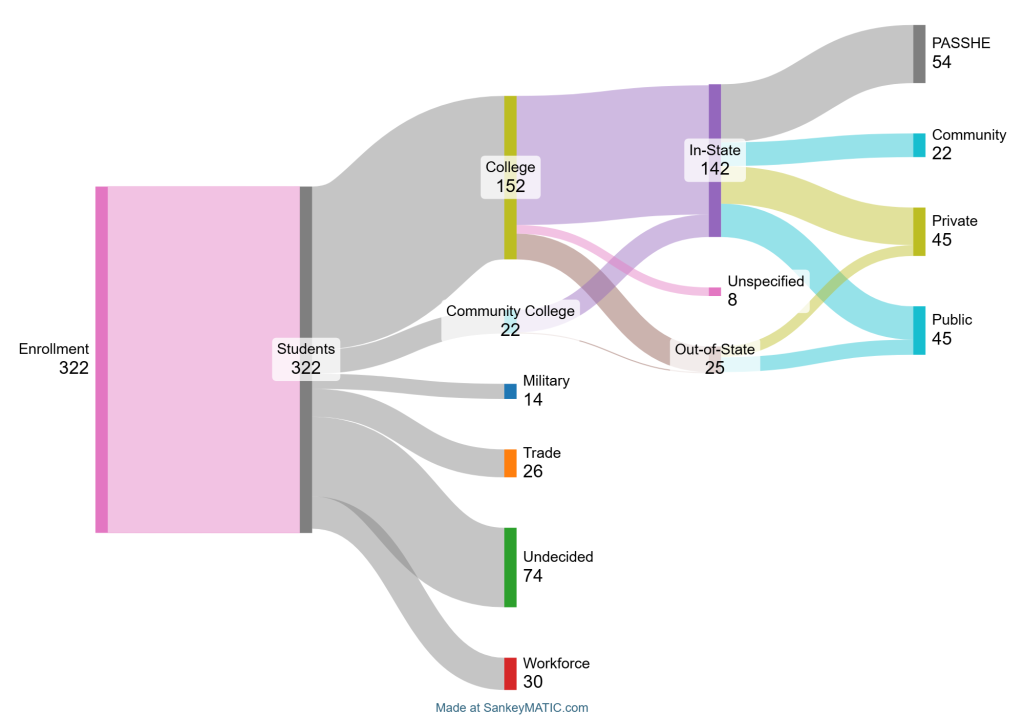
This Sankey diagram gives us a bird’s-eye view of where the 322 graduating students from Exeter High School’s Class of 2025 are headed after tossing their caps. Let’s walk through it step by step.
- Everyone starts in the same place — 322 students enrolled.
- From there, they branch into five main post-graduation categories:
- College (152 students)
- Community College (22)
- Trade School (26)
- Military (14)
- Workforce (30)
- Undecided (74) — these are students who didn’t publicly state their plans, which we’re treating as “undecided.”
Now, let’s zoom in on the college-bound group, which makes up almost half the class.
- Of the 152 students going to college, most are staying in-state (142), while 24 are heading out-of-state (yes, that adds to more than 152. Some students may have been double-listed or categorized in multiple ways, which is common in student-reported data).
- Among those staying in-state, 54 are attending PASSHE schools (such as Kutztown or West Chester), 19 are at community colleges, and the remainder are split between private (45) and public (45) institutions.
- There are also eight students whose specific college details were unspecified beyond the general label of “college”.
What’s powerful about this diagram is how it shows the flow of student decisions—not just where they end up, but how they move through categories. It helps us see, for example, that community colleges aren’t only for those who say “community college” outright, some are included within the in-state pathways, too.
The large number of unlisted students reminds us that not everyone knows or shares their plans by graduation. That’s a story in itself, and part of what this year’s analysis explores more deeply.
Which Colleges Are Exeter Grads Choosing?
This chart breaks down the top colleges that Exeter graduates from the Class of 2025 plan to attend, organized by type of institution: PASSHE (public state system schools), private colleges, and other public universities.
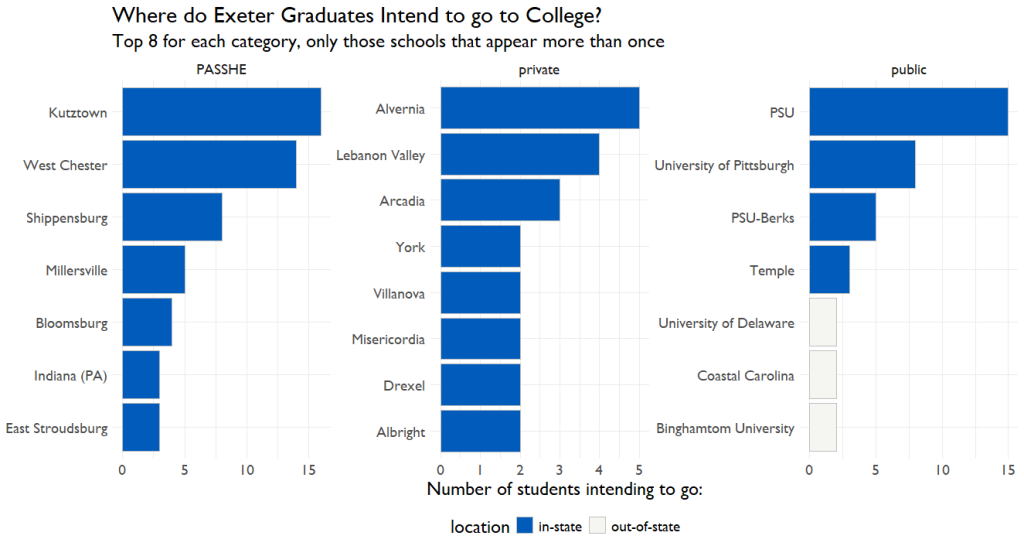
A few standouts:
- Kutztown and West Chester are the most popular PASSHE choices, with Kutztown leading the pack.
- Among private schools, students are heading to a wide variety of campuses, with Alvernia and Lebanon Valley topping the list (both pretty local choices)
- On the public side, Penn State (PSU) continues to dominate. It’s the single most popular destination overall, followed closely by the University of Pittsburgh and PSU–Berks (which I treated as separate in the data.
You can also see a few out-of-state picks (in light gray), like the University of Delaware, Coastal Carolina, and Binghamton University, though most students are staying in Pennsylvania.
This breakdown gives us a clearer picture of student preferences: a strong lean toward in-state, public options, with a healthy mix of smaller private schools and a few out-of-state adventures.
What Has Changed in Exeter Over Time?
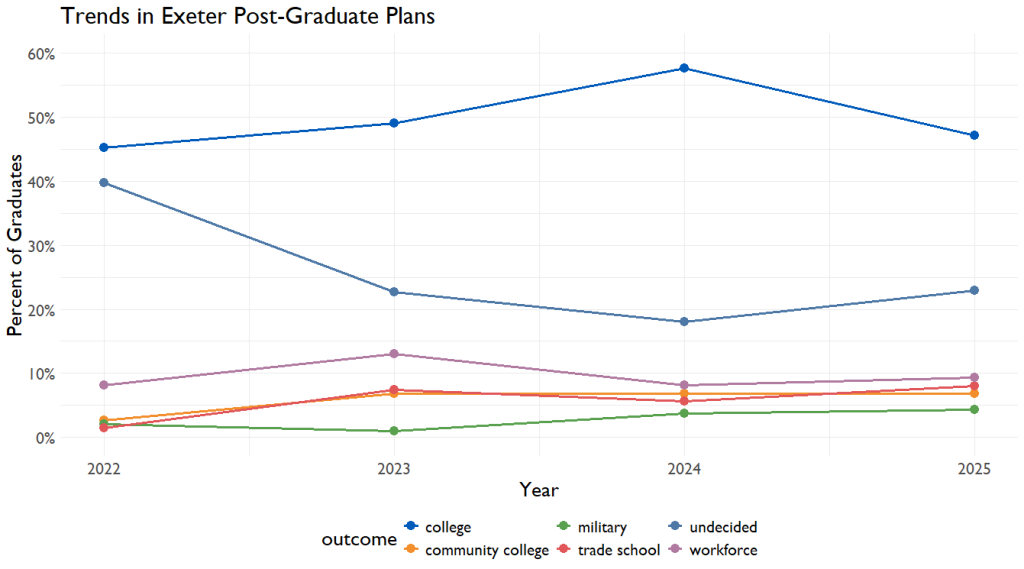
This line graph illustrates four years of trends in the post-high school plans of Exeter graduates. Each line represents a different outcome: college, community college, trade school, military, workforce, or undecided.
Here’s what stands out:
- College remains the most common path, with a peak in 2024, when over 55% of students planned to attend. That was the high point, followed by a dip in 2025.
- Undecided students dropped sharply after 2022. In 2022, approximately 40% of students hadn’t shared their plans; by 2024, that number had dropped below 20%.
- Community college and trade school saw small but steady increases. In particular, interest in trade schools grew more consistently, reaching nearly 10% by 2025.
- Military enlistment remained relatively low throughout but ticked upward slightly in 2024 and 2025.
- Workforce plans (going straight to work) also grew modestly after 2022 and leveled off.
After a post-pandemic period of uncertainty in 2022, more students have been making concrete decisions. While college remains the dominant choice, other paths, such as trade school and the workforce, are becoming increasingly popular. This suggests a gradual shift toward practical, career-ready options that don’t necessarily require a four-year degree.
What are we looking at?

This chart shows us how students’ plans after graduation changed between 2022 and 2025. We’re asking: Did more (or fewer) students choose certain paths in some years than we’d expect? This heatmap highlights which post-graduation outcomes were more or less common than expected each year. Here’s how to read it:
- Blue = more students than expected chose this path
- Red = fewer students than expected
Focusing on the biggest new insights:
- Trade school enrollment in 2025 was significantly higher than expected, marked by a strong blue square. This suggests a late-breaking surge in interest in hands-on, skills-based training.
- Military enlistment in 2025 was also higher than predicted, another blue cell, indicating increased interest in service-oriented careers.
- Workforce participation in 2023 came in lower than expected (red), even though overall interest was rising. This might suggest some students initially considering work ultimately changed direction or didn’t report plans.
- The “undecided” category in 2022 stands out with the deepest blue on the chart, meaning far more students than expected didn’t report any post-graduation plans. This reflects a year of widespread uncertainty and hesitation about the future.
These deviations aren’t just noise—they show where student behavior diverged most from recent patterns. Even small groups can make big waves in the data when they shift unexpectedly.
The Big Picture
Over the past four years, a quiet but powerful story has unfolded in Exeter’s graduating classes, a story of uncertainty, adaptation, and evolving priorities.
Back in 2022, a large number of students were marked as “undecided,” unsure of what came next. That year stands out as one defined by hesitation, perhaps still feeling the ripple effects of the pandemic and a changing world. But by the very next year, that uncertainty had begun to fade. The number of undecided students dropped sharply, suggesting that students were regaining a sense of direction, and maybe even confidence.
In 2024, college surged back into focus. That year saw more students enrolling in four-year schools than expected, a sign that traditional higher education was still very much alive and appealing, even as national narratives questioned its value.
But 2025 painted a slightly different picture. Interest in trade schools and military service rose noticeably, hinting at a shift toward hands-on, practical, and purpose-driven paths. These aren’t fallback options—they’re becoming intentional choices.
The decision to head straight into the workforce saw a brief rise in 2023, perhaps driven by economic necessity or local job availability. Still, that trend cooled in the years that followed.
Taken together, these shifts may be telling us something deeper: that students are responding not only to personal aspirations but to larger forces around them: a shaky job market, especially in public-facing sectors like health and education and a shifting economy that’s reshaping what opportunity looks like;.
What Does This Mean for School Leaders?
The landscape of post-graduation plans is shifting, and it’s happening fast. College is no longer the only, or even the assumed, next step. More students are exploring trade schools, military service, or entering the workforce directly. Others are still figuring it out, needing time, space, and guidance to make a decision.
But it’s not just about where students go, it’s also about how well they do once they get there. Take this for example:
- Students who attend Penn State have an 83% graduation rate.
- Those who attend PASSHE schools graduate at a much lower rate, just 57% on average.
That gap has real consequences. It suggests that even when students enroll in college, they may not receive the support they need to complete their studies, especially if they end up in institutions with fewer resources or higher dropout rates.
So what can schools do?
- Expand college counseling to focus on fit, not just access. It’s not enough to get students into college, we need to help them land in places where they’re likely to thrive and graduate.
- Integrate real options beyond four-year degrees. That means serious support for pathways into trades, apprenticeships, military careers, and community-based training, especially for students who may not see themselves on a traditional college track.
- Reach undecided students early and often. Create intentional opportunities for exploration through mentorships, job shadowing, or career discovery programs that are proactive, not reactive.
When school leaders embrace the full range of post-secondary paths, they send a powerful message: every future matters, and every student deserves a clear, supported road to get there. It’s not about tracking kids—it’s about unlocking choices. And in a world that’s changing quickly, that’s one of the most future-ready things a school can do.
Ready to Stay Ahead of the Curve?
If you found this deep dive into student outcomes compelling, you’re exactly the kind of reader we created This Week in School Psychology for.
Every week, we break down the latest research in education and mental health, so school leaders, psychologists, counselors, and engaged community members like you can stay informed, inspired, and ready to act.
Subscribe today for just $5/month or $50/year and get access to:
- The most relevant studies on youth development, career readiness, and school-based mental health—translated into plain, practical language.
- Timely, daily access to insights that help you support students not just academically, but holistically.
- A growing community of professionals and advocates who believe data should drive change, not gather dust.
Click here to view a sample issue and see what you’re missing.
Whether you’re shaping school policy, guiding individual students, or just want to understand the forces shaping education today, This Week in School Psychology gives you the clarity and context to lead with confidence.
✅ Join us.
✅ Stay informed.
✅ Be the change your students need.